IOD watch ← Back to the dashboard
Week ending 20 September 2026 · 2019 shown throughout as the record positive-IOD reference · rebuilt every refresh.
Where are we headed
| ACCESS-S2, init 2026-09-19 | Oct 2026 | Nov 2026 | Dec 2026 | Jan 2027 | Feb 2027 | Mar 2027 |
|---|---|---|---|---|---|---|
| Ensemble mean DMI | +1.0 | +0.9 | +0.8 | +0.4 | +0.1 | +0.1 |
| P(positive, ≥+0.4) | 100% | 97% | 83% | 47% | 21% | 12% |
| P(neutral) | 0% | 3% | 17% | 53% | 79% | 85% |
| P(negative, ≤-0.4) | 0% | 0% | 0% | 0% | 0% | 3% |
BoM ACCESS-S2 is one model system, updated weekly. IRI's figure below is multi-model but monthly.
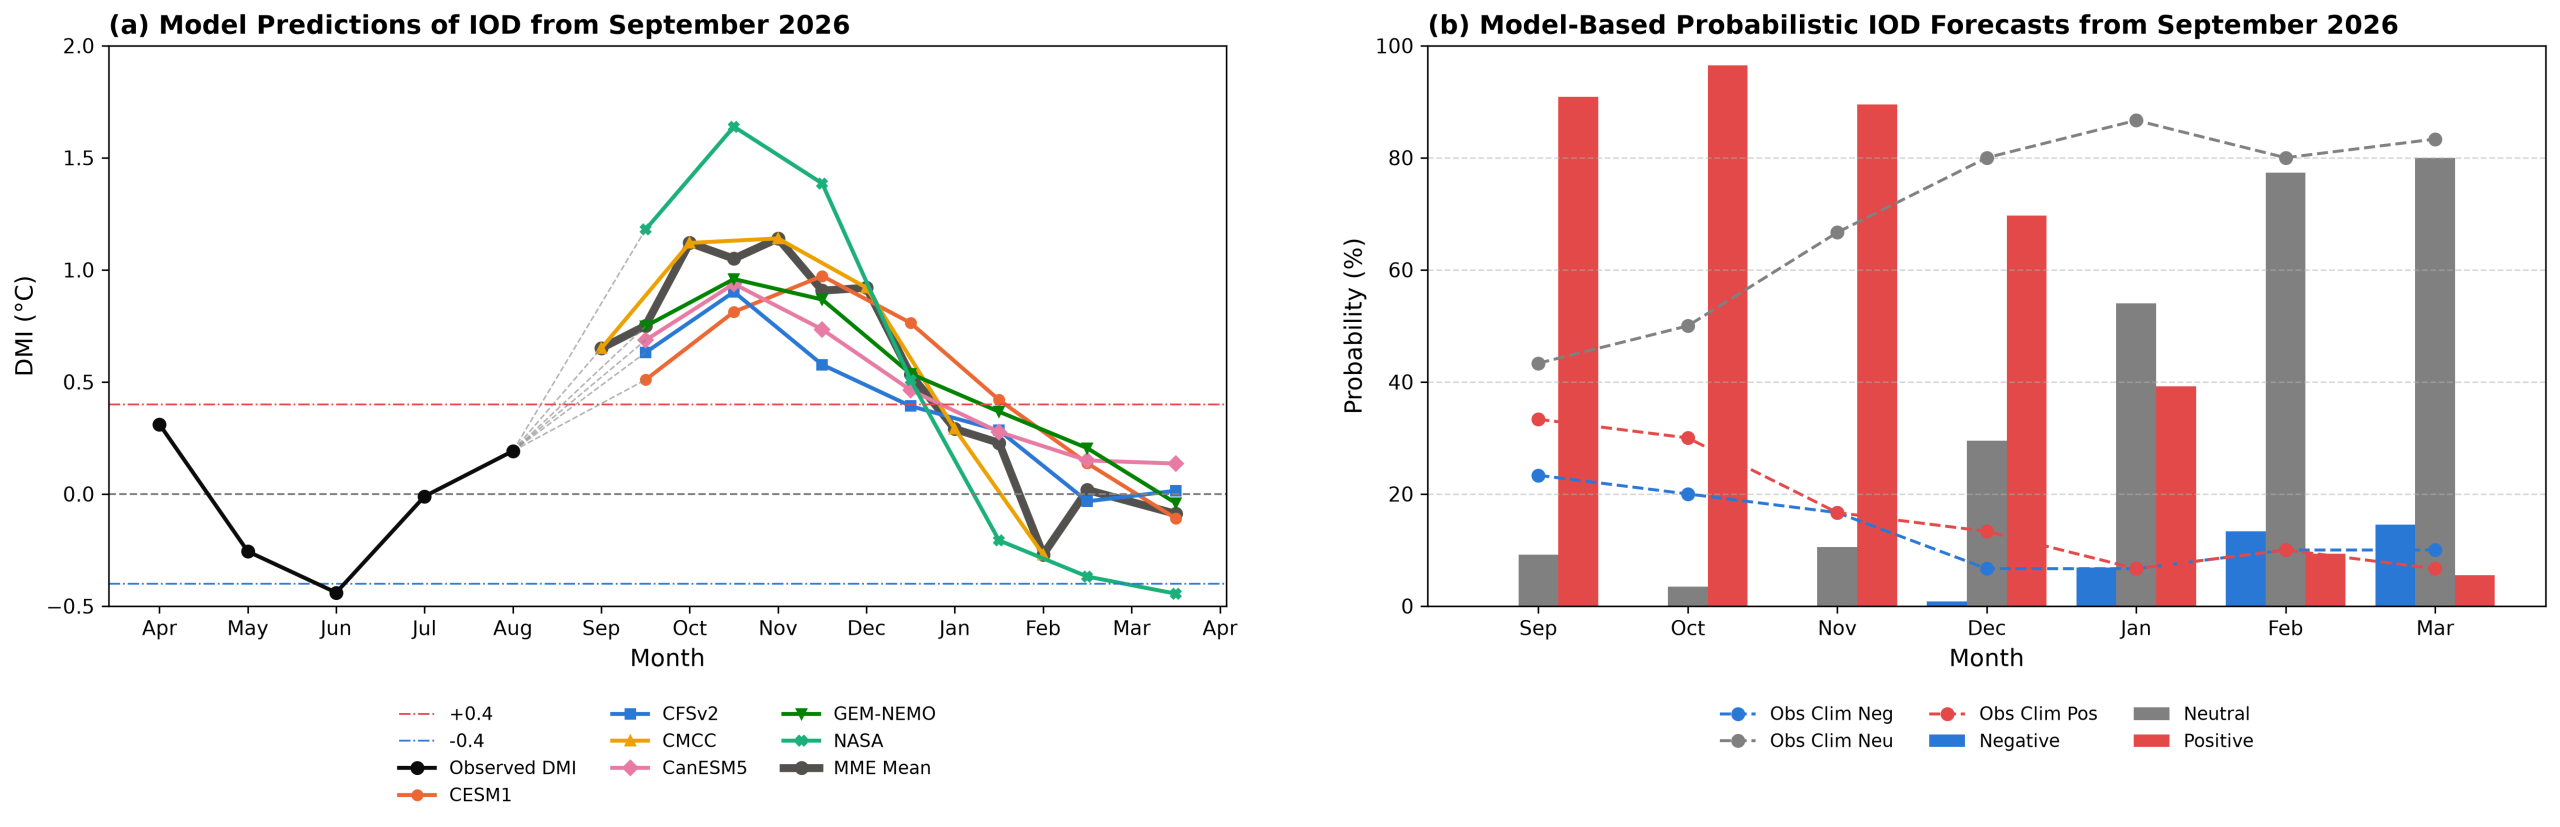
September 21, 2026 IOD Model Based Forecast · IRI/CPC, multi-model
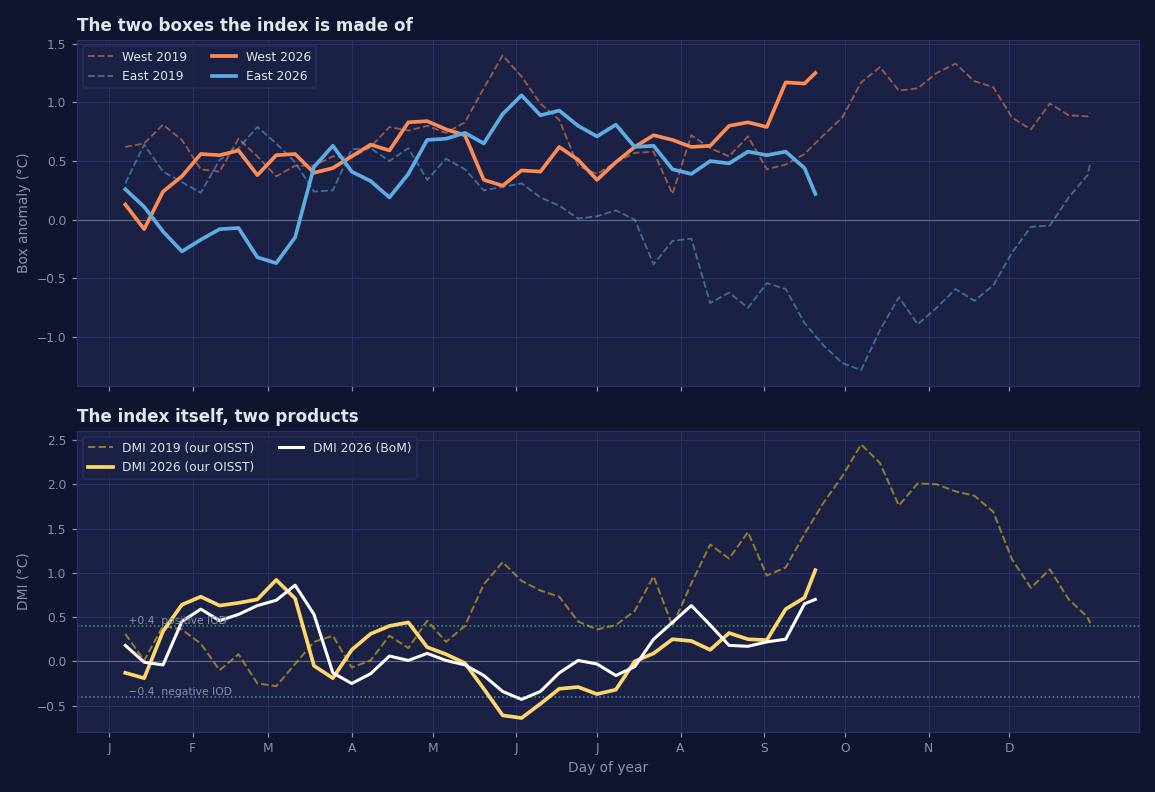
How the boxes are developing
What past dipoles did to the moisture over Kenya
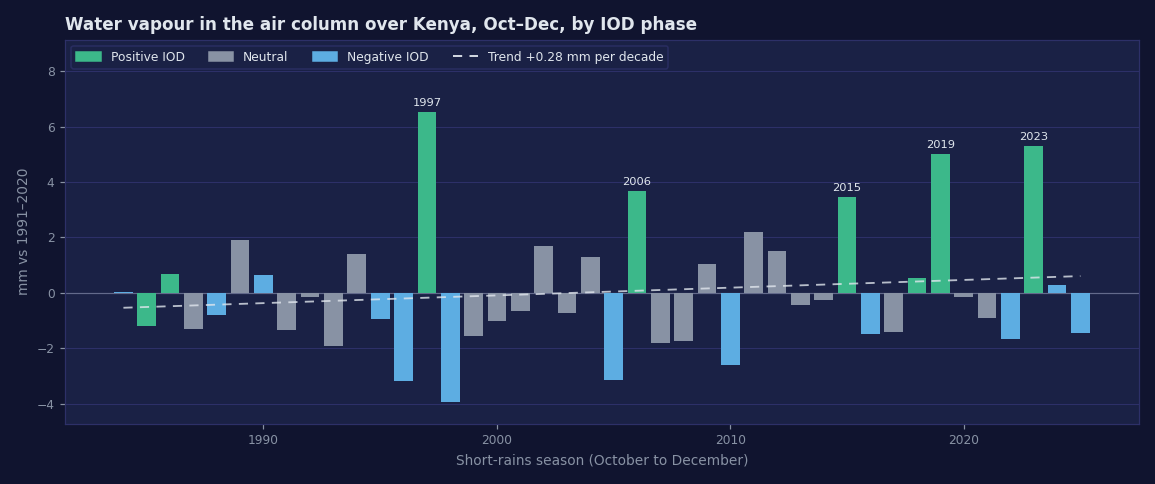
Total column water vapour (precipitable water) over Kenya in October to December, ERA5, as an anomaly against 1991–2020, one bar per season, coloured by that season's IOD phase. Positive-IOD seasons averaged +3.0 mm and short rains of +30%; negative-IOD seasons −1.5 mm and −20%. Warming adds about +0.28 mm per decade, while one positive-IOD season adds +3.0 mm on its own. The moisture over Kenya is the dipole's own fingerprint (r = 0.80 with the DMI): a record-moist atmosphere worldwide only turns into heavy short rains here once the dipole opens the gate. Through 2025; rebuilt by hand once a season is final in ERA5. Generated using Copernicus Climate Change Service information (2026).
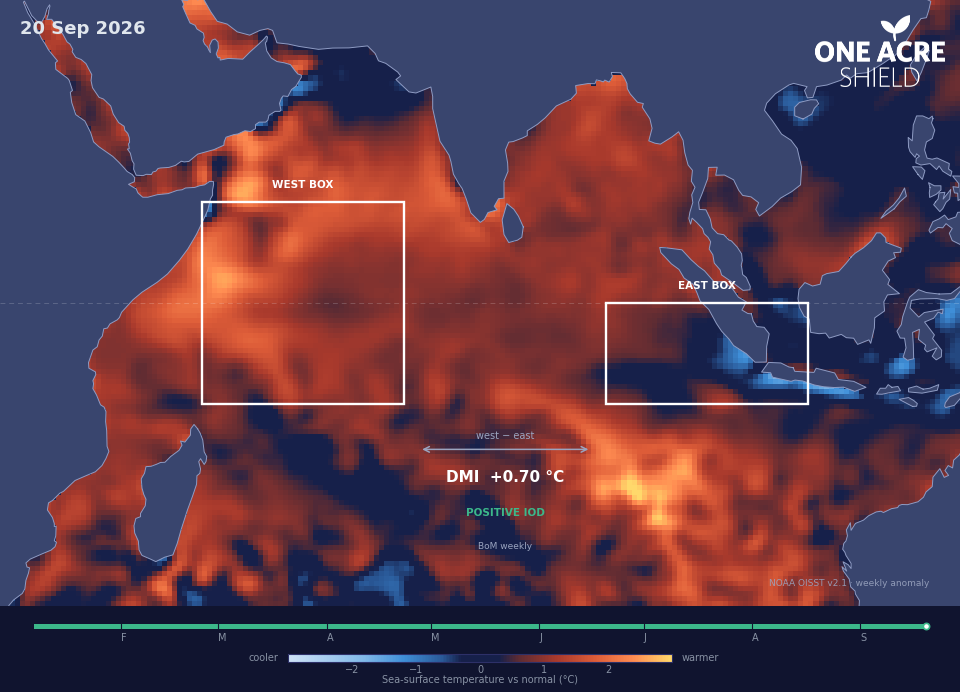
What the ocean looks like


Week by week
| Week ending | West | East | DMI ours | DMI BoM | Δ | 2019 W | 2019 E | 2019 DMI | |
|---|---|---|---|---|---|---|---|---|---|
| 20 Sep latest | +1.25 | +0.22 | +1.03 | +0.70 | +0.33 | +0.72 | -1.07 | +1.79 | |
| 16 Sep | +1.16 | +0.44 | +0.72 | +0.65 | +0.07 | +0.56 | -0.88 | +1.44 | |
| 09 Sep | +1.17 | +0.58 | +0.59 | +0.25 | +0.34 | +0.47 | -0.59 | +1.06 | |
| 02 Sep | +0.79 | +0.55 | +0.24 | +0.22 | +0.02 | +0.43 | -0.54 | +0.97 | |
| 26 Aug | +0.83 | +0.58 | +0.25 | +0.17 | +0.08 | +0.71 | -0.75 | +1.46 | |
| 19 Aug | +0.80 | +0.48 | +0.32 | +0.18 | +0.14 | +0.54 | -0.62 | +1.16 | |
| 12 Aug | +0.63 | +0.50 | +0.13 | +0.41 | -0.28 | +0.61 | -0.71 | +1.32 | |
| 05 Aug | +0.62 | +0.39 | +0.23 | +0.63 | -0.40 | +0.72 | -0.16 | +0.88 | |
| 29 Jul | +0.68 | +0.43 | +0.25 | +0.44 | -0.19 | +0.22 | -0.18 | +0.40 | |
| 22 Jul | +0.72 | +0.63 | +0.09 | +0.25 | -0.16 | +0.58 | -0.38 | +0.96 | |
| 15 Jul | +0.62 | +0.62 | +0.00 | -0.06 | +0.06 | +0.57 | -0.00 | +0.57 | |
| 08 Jul | +0.49 | +0.81 | -0.32 | -0.16 | -0.16 | +0.49 | +0.08 | +0.41 | |
| 01 Jul | +0.34 | +0.71 | -0.37 | -0.03 | -0.34 | +0.39 | +0.03 | +0.36 | |
| 24 Jun | +0.51 | +0.80 | -0.29 | +0.01 | -0.30 | +0.46 | +0.01 | +0.45 | |
| 17 Jun | +0.62 | +0.93 | -0.31 | -0.13 | -0.18 | +0.85 | +0.12 | +0.73 | |
| 10 Jun | +0.41 | +0.89 | -0.48 | -0.34 | -0.14 | +0.99 | +0.19 | +0.80 | |
| 03 Jun | +0.42 | +1.06 | -0.64 | -0.43 | -0.21 | +1.22 | +0.31 | +0.91 | |
| 27 May | +0.29 | +0.90 | -0.61 | -0.34 | -0.27 | +1.40 | +0.28 | +1.12 | |
| 20 May | +0.34 | +0.65 | -0.31 | -0.16 | -0.15 | +1.12 | +0.25 | +0.87 | |
| 13 May | +0.72 | +0.74 | -0.02 | -0.04 | +0.02 | +0.83 | +0.43 | +0.40 | |
| 06 May | +0.77 | +0.69 | +0.08 | +0.01 | +0.07 | +0.74 | +0.52 | +0.22 | |
| 29 Apr | +0.84 | +0.68 | +0.16 | +0.09 | +0.07 | +0.80 | +0.34 | +0.46 | |
| 22 Apr | +0.83 | +0.39 | +0.44 | +0.01 | +0.43 | +0.76 | +0.61 | +0.15 | |
| 15 Apr | +0.59 | +0.19 | +0.40 | +0.06 | +0.34 | +0.79 | +0.50 | +0.29 | |
| 08 Apr | +0.64 | +0.33 | +0.31 | -0.14 | +0.45 | +0.62 | +0.61 | +0.01 | |
| 01 Apr | +0.54 | +0.41 | +0.13 | -0.25 | +0.38 | +0.53 | +0.60 | -0.07 | |
| 25 Mar | +0.44 | +0.63 | -0.19 | -0.13 | -0.06 | +0.54 | +0.25 | +0.29 | |
| 18 Mar | +0.40 | +0.45 | -0.05 | +0.53 | -0.58 | +0.46 | +0.24 | +0.22 | |
| 11 Mar | +0.56 | -0.15 | +0.71 | +0.86 | -0.15 | +0.46 | +0.49 | -0.03 | |
| 04 Mar | +0.55 | -0.37 | +0.92 | +0.69 | +0.23 | +0.37 | +0.65 | -0.28 | |
| 25 Feb | +0.38 | -0.32 | +0.70 | +0.63 | +0.07 | +0.54 | +0.79 | -0.25 | |
| 18 Feb | +0.59 | -0.07 | +0.66 | +0.53 | +0.13 | +0.69 | +0.61 | +0.08 | |
| 11 Feb | +0.55 | -0.08 | +0.63 | +0.46 | +0.17 | +0.41 | +0.51 | -0.10 | |
| 04 Feb | +0.56 | -0.17 | +0.73 | +0.59 | +0.14 | +0.43 | +0.23 | +0.20 | |
| 28 Jan | +0.37 | -0.27 | +0.64 | +0.45 | +0.19 | +0.68 | +0.32 | +0.36 | |
| 21 Jan | +0.24 | -0.10 | +0.34 | -0.04 | +0.38 | +0.81 | +0.41 | +0.40 | |
| 14 Jan | -0.08 | +0.11 | -0.19 | -0.01 | -0.18 | +0.65 | +0.64 | +0.01 | |
| 07 Jan | +0.13 | +0.26 | -0.13 | +0.18 | -0.31 | +0.62 | +0.31 | +0.31 |
Our DMI is the west-box minus east-box mean of NOAA OISST v2.1 weekly anomalies. BoM's uses a different SST product and climatology; the two track closely in shape (r = 0.95 over 2019) but differ by about 0.2 °C typically, which is why both are shown. Δ is ours minus BoM.